OK. Take this with a grain of salt.
Each time I’ve checked, the Kendeda Building for Innovative Sustainable Design has been producing at least five times the power it was using.
Caveat No. 1: I’ve managed to check the gauges only on sunny or partly sunny days. The solar panels won’t generate nearly as much power (if any at all) at night or during storms.
Caveat No. 2: It’s fall, when there tends to be lower demand for air conditioning than in the summer and for heat than there in the winter.
Caveat No. 3: Although a constant flow of events and visitors have occupied the Kendeda Building over the past month, the building won’t have a full schedule classes until January. So it isn’t yet considered “fully occupied.”
Still, project team members view the early numbers as glad tidings.
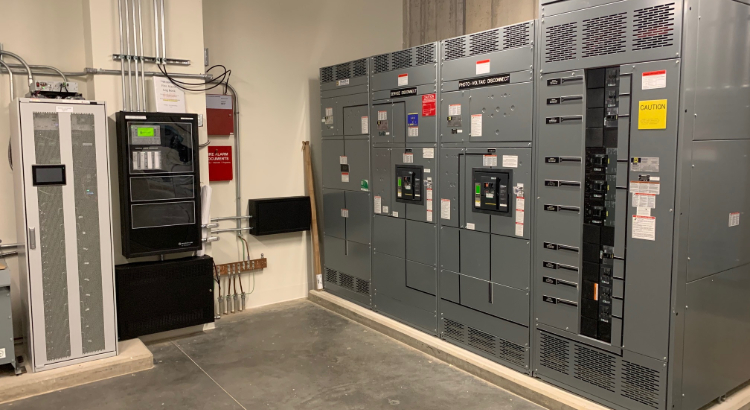
“Just to give you an idea, we were using more power a few months ago when we were finishing up work on the building than it’s using now that it’s occupied,” Skanska sustainability manager Jimmy Mitchell said last week as we checked the LED monitors in the electrical control room.
At that moment, on a cloudy day, the devices showed the solar array’s 935 photovoltaic modules generating at 331 amps, while 284 amps were being sent to the grid. In other words, the building was producing more than seven times the power that was being used by all its lights, computers, audio-visual systems, cellphone chargers, fans and other electrical devices.
On an earlier visit to the control room, around Labor Day, it was hot and sunny. More of the mechanical system was in use, to cool the building. But the solar panels were cranking at around 570 amps, with 500 of those amps going to the grid. On that day, the Epsten Group’s Darren Draper, commissioning agent for the building on behalf of Georgia Tech, described how various tracking systems and pieces of equipment worked together in the control room (see video below).
Asked if he expected the building to meet its goal of net-positive energy, Draper said, “Oh, yeah. I think we’re in very good shape.”
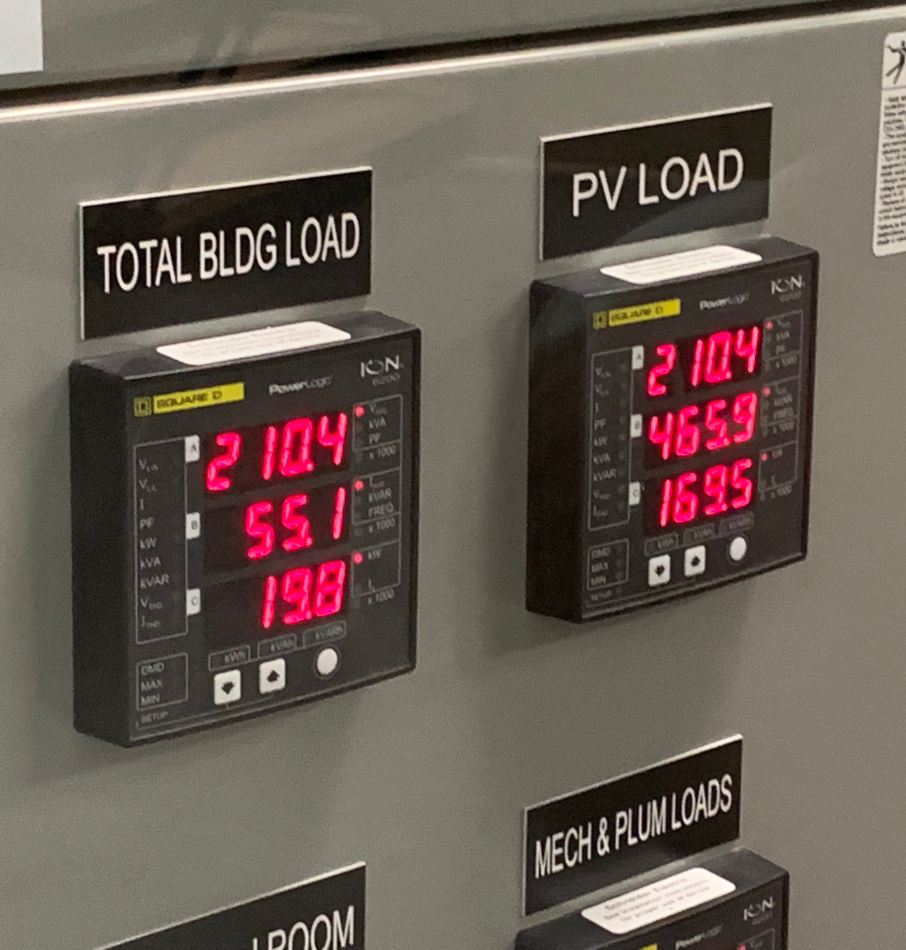
Other visits drew similar observations. In early October, when it was sunny and about 80 degrees, with a couple of events going on in building, the “PV load” was running around 300 amps, and the “total building load” was tracking at about 56 amps.
On the afternoon of the building’s Oct. 24 open house, an estimated 400 to 500 people were going in and out of the building. It also was such an ideal day — clear and about 70 degrees — that large folding doors on the side of the building could be left wide open. The PV load was bumping between 400 and 600 amps, and the building was consuming around 60 amps.
One of many requirements for Living Building Challenge certification is that, over a full year, the building produces at least 5 percent more clean energy onsite than that the building requires. Georgia Tech hasn’t started the clock on the 12-month performance period that will determine whether the building meets that definition of net-positive energy. That clock is expected to begin running during Spring semester, when the building is fully occupied with classes.
But those closely watching the Kendeda Building’s energy performance are sounding pretty optimistic about the net-positive requirement. Scott J. Duncan, a Georgia Tech research engineer who has been developing models for projecting energy use in the building, is among them.
“From the scenarios we looked at,” he told me during the open house, “we’re going to be in good shape.”
PHOTO AT TOP: The electronic control room. The batteries are stacked in the white cabinet on the left. Photo by Ken Edelstein.